A sponge?
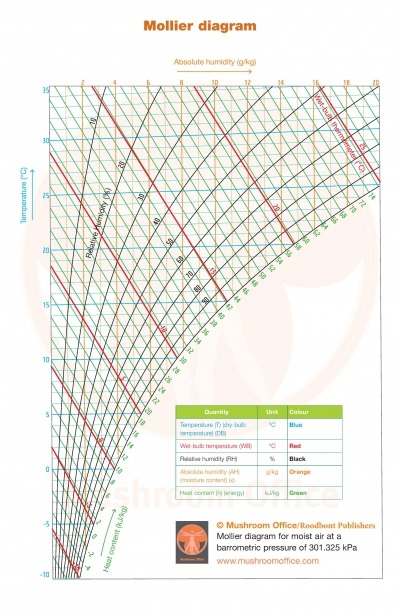
Air can be compared to a sponge. As air cools, it shrinks. This means its holds less moisture. The same thing happens if you squeeze a wet sponge. So how does this work in the Mollier diagram? Trace the blue line straight downwards and the diagram will literally show you what happens. The temperature drops and the RH rises. Following the lines in the Mollier diagram gives you insight into what happens to the climate. Simply reading values in an app doesn’t give you the same understanding. My philosophy is to draw lines on the diagram. Doing this will teach you much more about the effects on the climate that just reading some figures!
Conclusion: download the Mollier diagram and place it close to the climate controller so you gain a better understanding of what the climate controller does. If this doesn’t work, there are two options:
The basic settings in the climate controller are incorrect. In my consultancy role I often ask: “Why is the growing room climate set this way?” The answer is sometimes: “The computer controls and regulates the climate”. But who controls the computer? You do, so you have to understand how it works! If not, ask your advisor or installer for help.
Or
You don’t understand fully how the Mollier diagram works. For a good, step-by-step explanation take a look at chapter 6 about the Mollier diagram in the Mushroom Signals book. This chapter clearly explains all the principles of how to read and understand the diagram.
Mark den Ouden, Mushroom Office


